





The state still has far to climb just to reach the national average.
By Khushboo Rathore
Oregon Journalism Project
New data shows that over 7,000 more students in grades K–12 regularly attended classes in Oregon this past school year, an Oregon Journalism Project analysis shows.
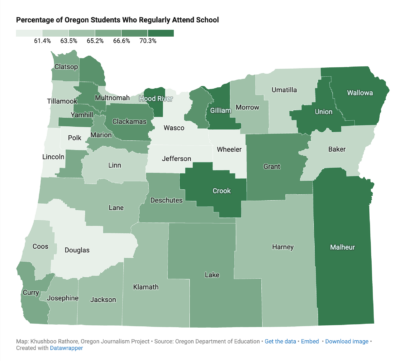
That bumps up the state’s regular attendance rate by 1.3 percentage points to 64.5%, according to the data, which shows attendance figures at each school in Oregon through May 1.
Oregon schools lag far behind the national average for regular attendance, which was 78% for the 2024–25 school year. In Oregon, more than one in three students are chronically absent, meaning they miss more than 10% of school days whether excused or not.
Research shows regular school attendance is paramount to student success. Yet Oregon doesn’t have a culture that prioritizes educational outcomes, said Sara Kerr, an Oregon parent and consultant for Results for America, a research nonprofit for public policymakers.
“We aren’t seeing consistently set and held high expectations for kids, and that’s felt by students, and that’s felt by parents,” Kerr said. “It’s creating an education environment where it continues to feel like it’s a ‘nice to have’ and not a ‘must have.’”
A few highlights from the attendance data, which the Oregon Department of Education released to OJP:
- Only 26 of the state’s nearly 1,300 public schools, including charter and virtual schools, hit the 90% benchmark for regular attendance this past school year.
- Native American students had the lowest regular attendance rate, 52.5%.
- Native Hawaiian and Pacific Islander students had a 1.3-point drop in regular attendance from the 2023–24 school year.
- Asian students had the highest regular attendance rate at 77.7%.
- Black students made the largest gains in regular attendance over the past two school years, climbing from 56.4% to 62.5%.
- Students in Malheur County, in the southeast corner of the state, have the highest rate of regular attendance at 83.5%. Wheeler County in Central Oregon had the lowest, 41.1%.
READ MORE: The Truancy Mutiny
For years, the Department of Education shared this kind of data only once a year—months after school ended for the summer. A new law requires the department to share the data four times a year, starting this fall.
Meanwhile, OJP has obtained 2025–26 attendance data through May 1 for every public school in Oregon. This data has been updated in our Attendance Tracker.
Jessica Cobian, a policy manager at Stand for Children, said having statewide attendance data in near real time, like Ohio, Rhode Island and other states do, would allow Oregon schools to more quickly address problems that students may be having.
“It’s a whole community effort to reengage students, and awareness is one of the first steps,” Cobian said. “This is happening during the school year, which is key.”
Support from and engagement by adults in the schools is critical to improving attendance, Kerr said.
“The connection and relationship between a student and at least one trusted adult in a building continues to be, based on research, one of the most important drivers of students regularly attending,” Kerr said.
NOTE: The database lists 1,282 schools in Oregon. Several schools did not report attendance data to the state for this attendance period. If ODE listed the percentage of regular attenders as “>95%” (greater than 95%), we adjusted those rates to 95% for clarity.
READ OJP’s series “Oregon Schools: What Went Wrong” at https://www.oregonjournalismproject.org/oregon-schools-what-went-wrong
We are researching Oregon’s growing use of remote learning through online public charter schools and distance learning schools. We rely on readers like you to help us do our jobs. If you are a parent, student, teacher, taxpayer, former or current employee or owner, you are encouraged to share your experiences by using this confidential online form.